Getting Started
01-getting-started.RmdSummArIzeR is an R package, that allows an easy use of
EnrichR to compare enrichment results from multiple
databases of multiple conditions. It results in a clustering of enriched
terms and enables the annotation of these terms by creating a promt for
large language models such as gpt4. Results can be visualized in a
Bubbleplot or Heatmap.
Installation
You can install the development version of SummArIzeR from GitHub with:
# Install devtools if not already installed
install.packages("devtools")

# Install SummArIzeR
devtools::install_github("bonellilab/SummArIzeR")

# Additional packages

# Install factoextra from CRAN
install.packages("factoextra")

# Install `enrichR`
devtools::install_github("wjawaid/enrichR")
Example
This is a basic example which shows you how to run
SummArIzeR. We create an example dataframe from two
celltypes and two conditions:
library(SummArIzeR)
library(enrichR)
library(factoextra)

set.seed(1234)

genelist_df <- data.frame(
  genes = c(
    "IL6", "IFNG", "IL10", "TNF", "CXCL8", "STAT3", "STAT1", "JAK1", "JAK2", "SOCS1",
    "SOCS3", "IL1B", "IL18", "IL12A", "IL23A", "GATA3", "RORC", "CCR7", "CXCR3", "CCL2",
    "CCL5", "IRF4", "IRF5", "IL4R", "IL2", "FOXP3", "TGFB1", "IL7R", "IL15", "NFKB1",
    "IL21", "CXCR5", "TYK2", "IL22", "IL17A", "IL17F", "MCP1", "IL1RN", "CXCL10", "CXCL11",
    "CD40LG", "IL6R", "IL27", "CD28", "CD80", "CD86", "IL2RA", "CTLA4", "PDCD1"
  ),
  Comparison = c(
    "Disease1_vs_Control", "Disease1_vs_Control", "Disease2_vs_Control", "Disease1_vs_Control", "Disease1_vs_Control", "Disease1_vs_Control", "Disease2_vs_Control", "Disease2_vs_Control", "Disease1_vs_Control", "Disease2_vs_Control",
    "Disease1_vs_Control", "Disease1_vs_Control", "Disease2_vs_Control", "Disease1_vs_Control", "Disease1_vs_Control", "Disease2_vs_Control", "Disease1_vs_Control", "Disease2_vs_Control", "Disease1_vs_Control", "Disease1_vs_Control",
    "Disease2_vs_Control", "Disease1_vs_Control", "Disease1_vs_Control", "Disease2_vs_Control", "Disease1_vs_Control", "Disease2_vs_Control", "Disease2_vs_Control", "Disease2_vs_Control", "Disease1_vs_Control", "Disease1_vs_Control",
    "Disease1_vs_Control", "Disease2_vs_Control", "Disease2_vs_Control", "Disease1_vs_Control", "Disease1_vs_Control", "Disease1_vs_Control", "Disease1_vs_Control", "Disease2_vs_Control", "Disease1_vs_Control", "Disease1_vs_Control",
    "Disease1_vs_Control", "Disease1_vs_Control", "Disease2_vs_Control", "Disease2_vs_Control", "Disease2_vs_Control", "Disease1_vs_Control", "Disease2_vs_Control", "Disease2_vs_Control", "Disease2_vs_Control"
    ),
  CellType = c(
    "CD4", "CD4", "CD4", "Monocytes", "Monocytes", "CD4", "CD4", "Monocytes", "CD4", "Monocytes",
    "CD4", "Monocytes", "Monocytes", "CD4", "CD4", "CD4", "CD4", "CD4", "CD4", "Monocytes",
    "Monocytes", "CD4", "Monocytes", "CD4", "CD4", "CD4", "Monocytes", "CD4", "Monocytes", "Monocytes",
    "CD4", "CD4", "Monocytes", "CD4", "CD4", "CD4", "Monocytes", "Monocytes", "CD4", "CD4",
    "CD4", "Monocytes", "CD4", "CD4", "Monocytes", "Monocytes", "CD4", "CD4", "CD4"
  ),
  log2fold = c(1.65922417, 1.74830165, -0.85544186, 1.32179050, 0.56698208, 0.07638380, 0.94635326, -1.46133361, 0.62796916, 0.82025914, -0.16903290, 0.87644901, 1.73868899, -0.97828470, -0.15082871, 1.76005809, 1.91290571, -1.53005055, -0.10001167, 0.24133098, 1.61612555, -1.44515933, 1.95556692, 1.78667293, -1.67024977, 0.05684714, -0.43918613, 1.62295252, -0.21212149, 1.34401704, 0.95038247, 1.24422057, -0.44756687, 0.74067892, -1.98420664, 1.33166432, -1.97066341, -1.16936411, 1.62640563, 0.44711457, -0.48176304, -0.25691366, -1.85027587, 1.89415966, -0.27299500, 1.83030639, 1.55101962, 0.55991508, 1.88386644)
)
We can perform enrichment analysis across the different conditions: CellType and Comparison. In this example, we extract the top 5 enriched terms from each database and for every condition.
The input is a data.frame containing gene-level data, with the following required columns:
genes: character vector of gene symbols.
conditions: condition labels (e.g., comparisons or cell
types).
log2fold (optional): used when splitting by
regulation.
If split_by_reg = TRUE (default is FALSE),
enrichment is performed separately for up- and down-regulated genes.
The logFC_threshold parameter (default: 0)
defines the log2 fold-change cutoff to distinguish up/down regulation
when using split_by_reg.
To filter enriched terms, an adjusted p-value
pval_threshold cutoff is applied.
Additional key parameters include:
n (default: 10): number of top enriched terms returned
per condition and per category.
min_genes_threshold (default: 3): minimum number of
overlapping genes required for a term to be considered in downstream
clustering and annotation.
The enrichment categories can be chosen from the set of
libraries available in EnrichR:
Termlist_all<-extractMultipleTerms(genelist_df, condition_col = c("CellType", "Comparison"), categories = c("GO_Biological_Process_2023","Reactome_2022", "BioPlanet_2019"), pval_threshold = 0.05, n = 5, split_by_reg = T)
head(Termlist_all, n = 5)## # A tibble: 5 × 6
## Term Genes adj_pval dbs condition regulation
## <chr> <chr> <dbl> <chr> <chr> <chr>
## 1 Cellular Response To Virus (GO:0098… IL21 3.46e-8 GO_B… CD4_Dise… up-regula…
## 2 Cellular Response To Virus (GO:0098… CXCL… 3.46e-8 GO_B… CD4_Dise… up-regula…
## 3 Cellular Response To Virus (GO:0098… IL6 3.46e-8 GO_B… CD4_Dise… up-regula…
## 4 Cellular Response To Virus (GO:0098… IFNG 3.46e-8 GO_B… CD4_Dise… up-regula…
## 5 Cellular Response To Virus (GO:0098… JAK2 3.46e-8 GO_B… CD4_Dise… up-regula…Edges below the similarity threshold ts are deleted. The
optimal threshold can be validated by checking the number of clusters,
the connected terms and the modularity. The threshold value determines
which edges between terms (nodes) are retained in the network (those
with a distance weight higher than ts). Smaller values
include more edges; larger values result in sparser graphs:
evaluateThreshold(Termlist_all)The network can be interactively visualized, and if needed, the threshold can be readjusted.
plot<-TRUplotIgraph(Termlist_all, ts  = 0.3)
#htmltools::tagList(plot)
plotAfter treshold adjustment, clusters can be assigned to the dataframe and the Prompt can be generated:
Genelist_test_cluster<-returnIgraphCluster(Termlist_all, ts = 0.3)
head(Genelist_test_cluster, n = 5)
## # A tibble: 5 × 8
## # Groups: condition, Term, regulation [5]
## Term adj_pval condition regulation Cluster dbs num_genes_per_term
## <chr> <dbl> <chr> <chr> <dbl> <chr> <int>
## 1 Cellular Respo… 3.46e-8 CD4_Dise… up-regula… 4 GO_B… 5
## 2 Positive Regul… 6.17e-8 CD4_Dise… up-regula… 4 GO_B… 5
## 3 Inflammatory R… 6.87e-8 CD4_Dise… up-regula… 6 GO_B… 6
## 4 Regulation Of … 6.87e-8 CD4_Dise… up-regula… 4 GO_B… 6
## 5 Cytokine-Media… 8.30e-8 CD4_Dise… up-regula… 1 GO_B… 6
## # ℹ 1 more variable: genelist_per_term <list>
generateGPTPrompt(Genelist_test_cluster)## Cluster 1:
## Please find a summary term for the following terms: Cytokine-Mediated Signaling Pathway (GO:0019221), Positive Regulation Of Cytokine Production (GO:0001819), Signaling By Interleukins R-HSA-449147, Cytokine Signaling In Immune System R-HSA-1280215, Interleukin-4 And Interleukin-13 Signaling R-HSA-6785807, Immune System R-HSA-168256, Jak-STAT signaling pathway, Interleukin-23-mediated signaling events, Cytokine-cytokine receptor interaction, Immune system signaling by interferons, interleukins, prolactin, and growth hormones, Signaling by interleukins, Interleukin-2 signaling pathway, Immune system, Interleukin-7 signaling pathway
##
## Cluster 2:
## Please find a summary term for the following terms: T Cell Differentiation (GO:0030217), T Cell Receptor Signaling Pathway (GO:0050852), T Cell Activation (GO:0042110), Costimulation By CD28 Family R-HSA-388841
##
## Cluster 3:
## Please find a summary term for the following terms: Regulation of NFAT transcription factors, RUNX1 And FOXP3 Control Development Of Regulatory T Lymphocytes (Tregs) R-HSA-8877330, Transcriptional Regulation By RUNX1 R-HSA-8878171
##
## Cluster 4:
## Please find a summary term for the following terms: Cellular Response To Virus (GO:0098586), Positive Regulation Of Tumor Necrosis Factor Superfamily Cytokine Production (GO:1903557), Regulation Of Inflammatory Response (GO:0050727), Regulation Of Interleukin-17 Production (GO:0032660), Regulation Of Tyrosine Phosphorylation Of STAT Protein (GO:0042509), Positive Regulation Of Lymphocyte Proliferation (GO:0050671), Interleukin-6 Signaling R-HSA-1059683, Interleukin-27-mediated signaling events, Interleukin-22 soluble receptor signaling pathway, Interleukin-12/STAT4 pathway
##
## Cluster 5:
## Please find a summary term for the following terms: Th1/Th2 differentiation pathway, Inflammatory response pathway
##
## Cluster 6:
## Please find a summary term for the following terms: Inflammatory Response (GO:0006954), Response To Lipopolysaccharide (GO:0032496), Cellular Response To Lipid (GO:0071396), Cellular Response To Molecule Of Bacterial Origin (GO:0071219), Cellular Response To Lipopolysaccharide (GO:0071222), Cellular Response To Cytokine Stimulus (GO:0071345), Interleukin-10 Signaling R-HSA-6783783, Toll-like receptor signaling pathway regulation, Regulation Of Calcidiol 1-Monooxygenase Activity (GO:0060558), Interleukin-3 regulation of hematopoietic cells, NOD signaling pathway, Chagas disease, Interleukin-1 regulation of extracellular matrix, NF-kappaB activation by non-typeable Hemophilus influenzae
##
## Cluster 7:
## Please find a summary term for the following terms: Regulation Of Protein Localization To Nucleus (GO:1900180), Positive Regulation Of Protein Localization To Nucleus (GO:1900182), Positive Regulation Of Protein Localization (GO:1903829)
##
## Cluster 8:
## Please find a summary term for the following terms: Positive Regulation Of Interleukin-10 Production (GO:0032733), Positive Regulation Of Interleukin-12 Production (GO:0032735)
##
## Cluster 9:
## Please find a summary term for the following terms: Selective expression of chemokine receptors during T-cell polarization
##
## Please summarize the following clusters of terms with a single term for each cluster.
## Then, assign the cluster numbers to these summary terms in an R vector, called `cluster_summary`, formatted as:
## '1' = 'Summary Term 1', '2' = 'Summary Term 2', ..., 'n' = 'Summary Term n'.The prompt can be queried using a LLM like ChatGPT. The result can be copied into R. Now, a final data frame containing the cluster annotations can be created:
#Enter vector from LLM
cluster_summary <- c(
  '1' = 'Cytokine and Interleukin Signaling in Immune Regulation',
  '2' = 'T Cell Activation and Differentiation',
  '3' = 'Regulation of T Cell Transcription Factors',
  '4' = 'Regulation of Inflammatory Cytokine Responses',
  '5' = 'T Helper Cell Differentiation and Inflammatory Responses',
  '6' = 'Innate Immune and Inflammatory Response to Pathogens',
  '7' = 'Regulation of Protein Localization to the Nucleus',
  '8' = 'Positive Regulation of Interleukin Production',
  '9' = 'Chemokine Receptor Expression During T Cell Polarization'
)

print(cluster_summary)
## 1
## "Cytokine and Interleukin Signaling in Immune Regulation"
## 2
## "T Cell Activation and Differentiation"
## 3
## "Regulation of T Cell Transcription Factors"
## 4
## "Regulation of Inflammatory Cytokine Responses"
## 5
## "T Helper Cell Differentiation and Inflammatory Responses"
## 6
## "Innate Immune and Inflammatory Response to Pathogens"
## 7
## "Regulation of Protein Localization to the Nucleus"
## 8
## "Positive Regulation of Interleukin Production"
## 9
## "Chemokine Receptor Expression During T Cell Polarization"The clusters can now be annotated based on the vectors defined above.
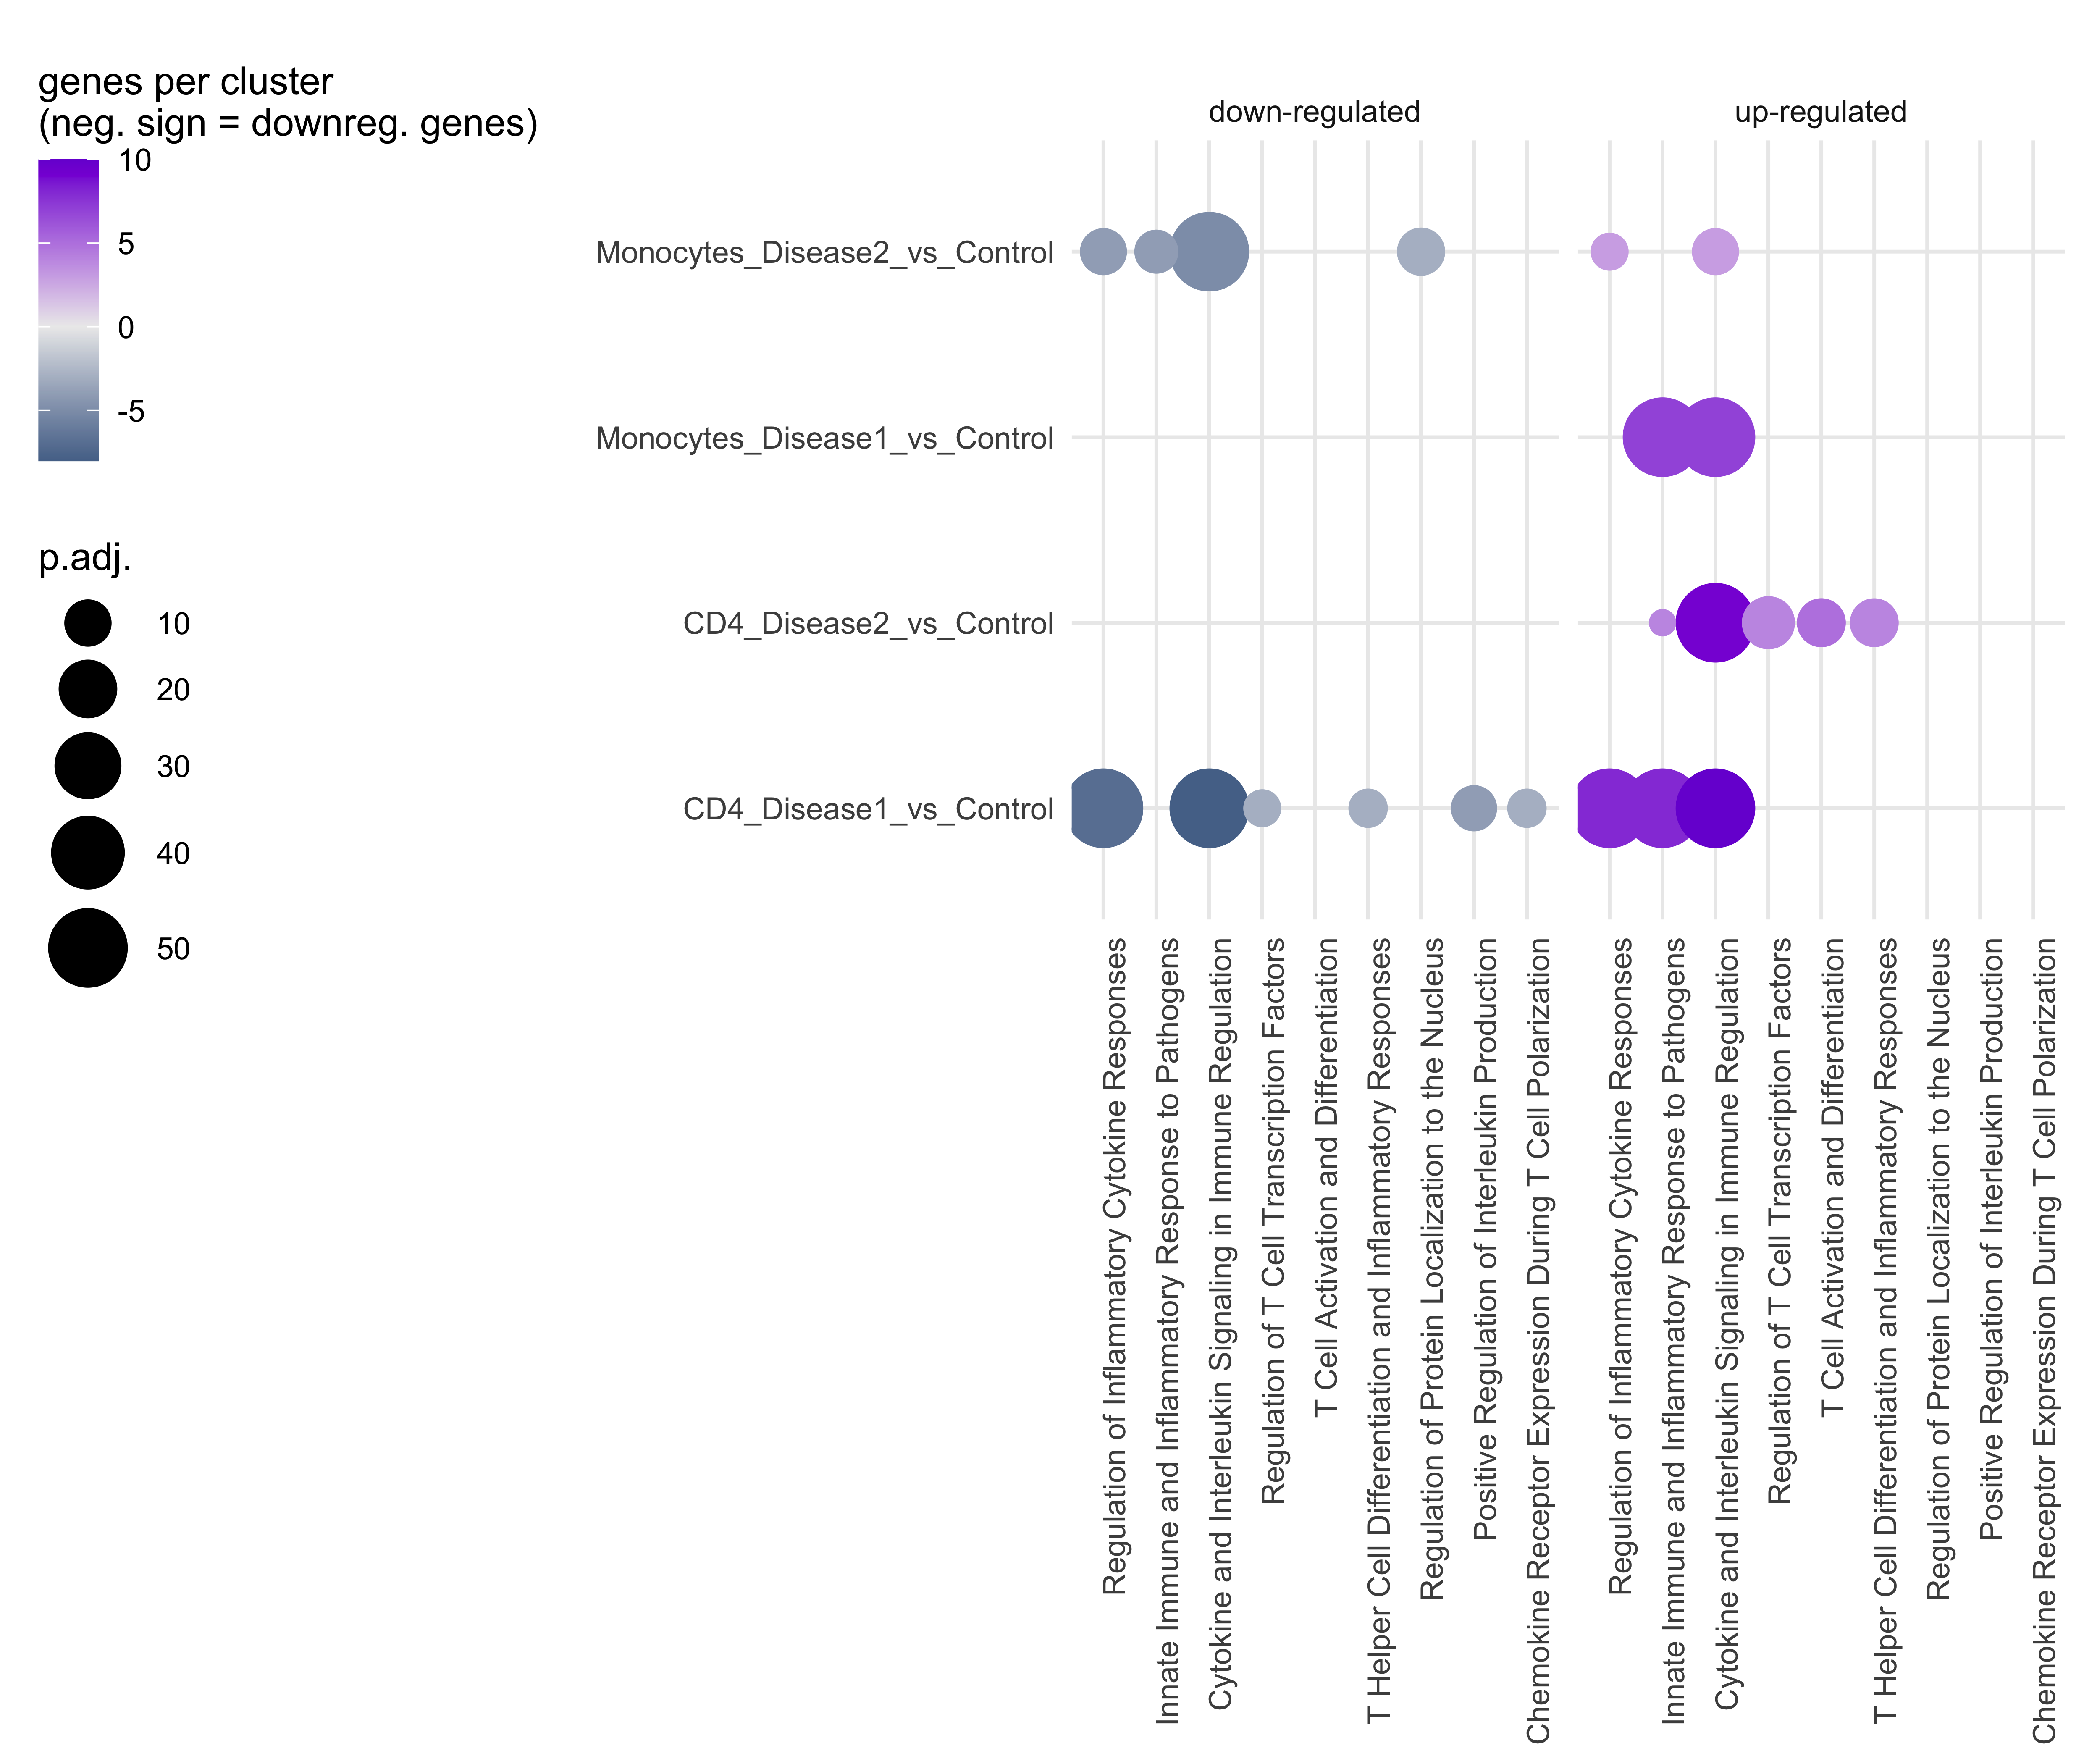
Annotation_list<- annotateClusters(Genelist_test_cluster, cluster_summary)The results can be plotted as a Bubbleplot. If the enrichment was done for up-and downregulation seperatly, the plot will be split for up-and downregulated genes.
plotBubbleplot(Annotation_list)